Java Self-Explanatory Simulators
Once you have started one of the Self-Explanatory Simulators, you should get
a screen like this.
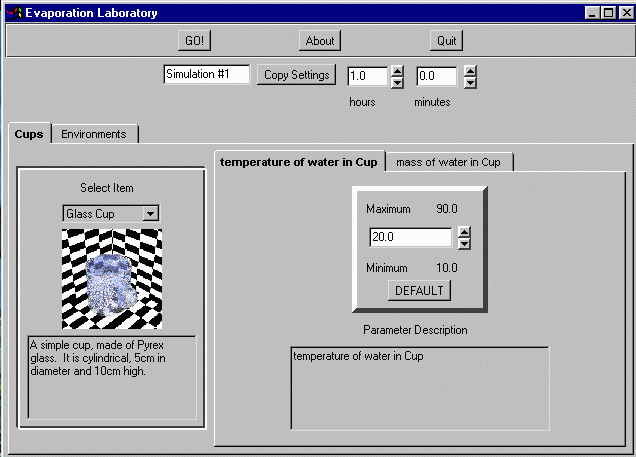
The panel at the top allows you to the change the name of the simulation and
its duration. The name of the simulation will not affect anything, but will
be used later to help you access the results from the simulation.
You can adjust the duration of the simulation by changing the time displayed
in the upper right hand corner. Feel free to type in a valid number or use the arrows to scroll. The program will notify you if the duration is invalid.
The lower panel allows for the selection of parameters and the manipulation of variables. The topmost tabs allow you to toggle between different
parameter sets. A parameter set is a group of parameters that can be used in
the simulation. In case of the Evaporation Laboratory the two parameter sets are cup material and location.
Beneath the parameter set tabs is a selector for specific parameters. A picture and description of the selected parameter is displayed. The set of tabs to the right allow selection between different parameters applicable to the current parameter set. You can adjust the value for a parameter by entering a number within the specified
range or by using the arrows.
When you have finished manipulating the selection, you can begin the simulation by pressing the GO! button. If one of the parameters, such as duration, has an invalid value, you will be notified. The simulation will not run until all parameters have valid values. A progress bar will appear and display the progress of the simulation. When it is finished, the results screen will appear.
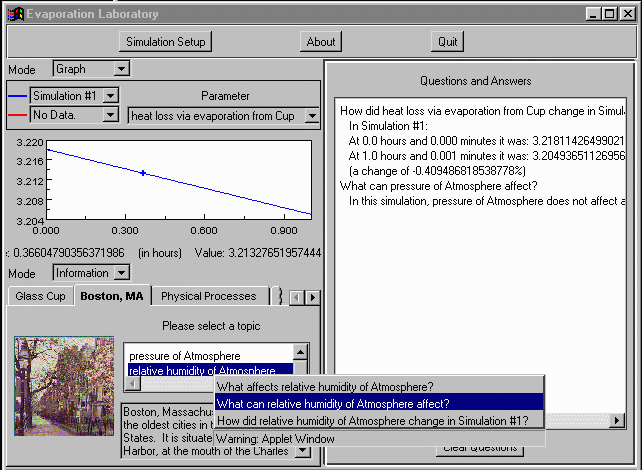
This screen may appear very complicated because of all the data it needs to display. The panel displayed at the upper left hand corner displays a graph of
the simulation. If you have run multiple simulations, you can select which
set of results to display. You can also select which parameter to display data for. By clicking on the graph with the left mouse button, you can determine
the precise value for a parameter at a point. By clicking on the graph with the right mouse button, you can access the explanation system. A pop-up menu
will appear with a list of possible questions. Click on a question to find
the answer.
The answer will appear in the larger panel on the right side of the screen. If one of the lines of the answer has a * in front of it, you can click it to ask another question.
Another source of questions is the Information panel in the lower left corner. The tabs allow you to select between what information is available such as the parameters specific to a prop, a summary of everything that happened during the simulation, or a list of events that occurred in the course of the simulation. Click on each item in the list of topics to see the list of questions.
If you want to see two Graph or Information panels, you can change the Mode selector. If you would like to
run a new simulation, press the Simulation Setup button.